No A+ setup jumping off the chart pre-market, so today is a watch-and-react day — I'll take what the market gives. But the lean is clear: the weekly is bearish and pointed at the previous week's low, and the daily draw is the Monthly BISI below (~28,450). Rallies into the premium are for selling, not chasing. Posted before the open, judged after.
A weekly profile is just an expected way the daily candles print across a week. They're not magic — they're common shapes the algorithm repeats. Naming the profile you're in tells you what each day's daily candle should do, so a single session stops being noise and becomes a step in a bigger sequence.
This Week: Classic Midweek Reversal
Mon
Up
Tue
Up / High
Wed
Tops out
Thu
Reverses ↓
TODAY
Fri
Delivers ↓
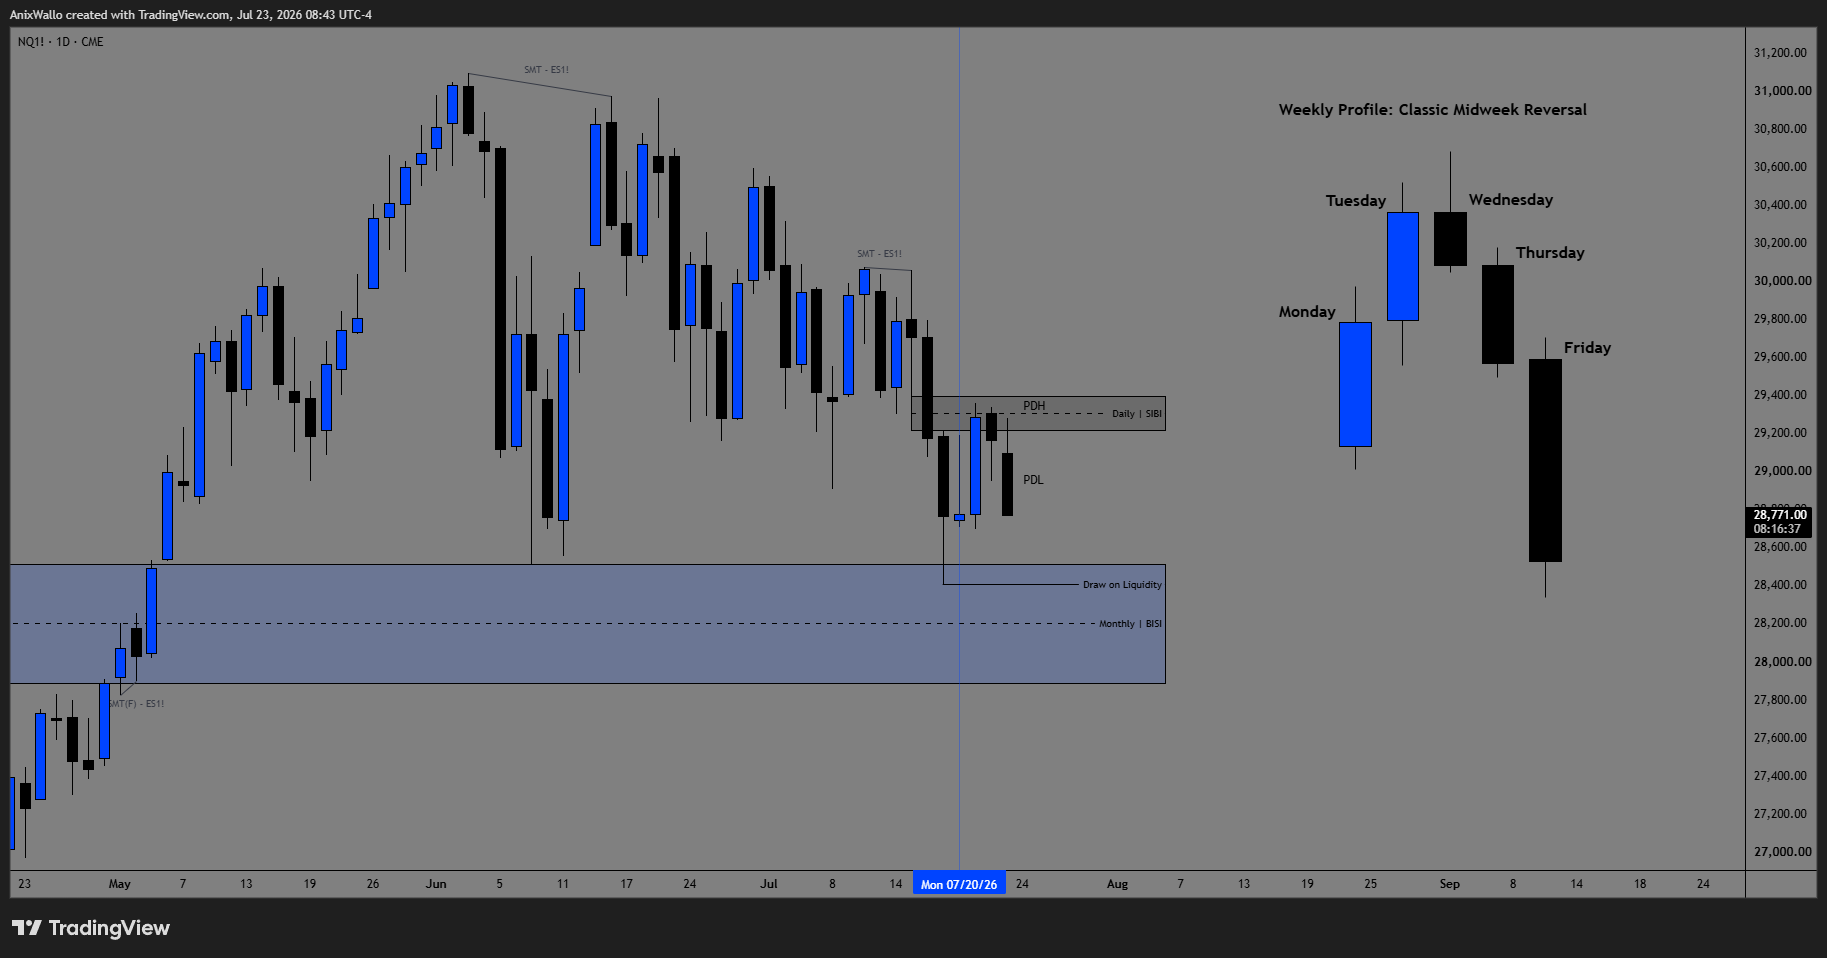
In a Classic Midweek Reversal, the week rallies early, tops out midweek, then sells off into Thursday and Friday. Today is Thursday — the reversal leg.That's why the bearish daily lean and the weekly draw below line up: the profile, the weekly structure, and the Monthly BISI draw are all pointing the same direction. When the timeframes agree like this, you don't need to force a pre-market entry — you let the day come to the level.
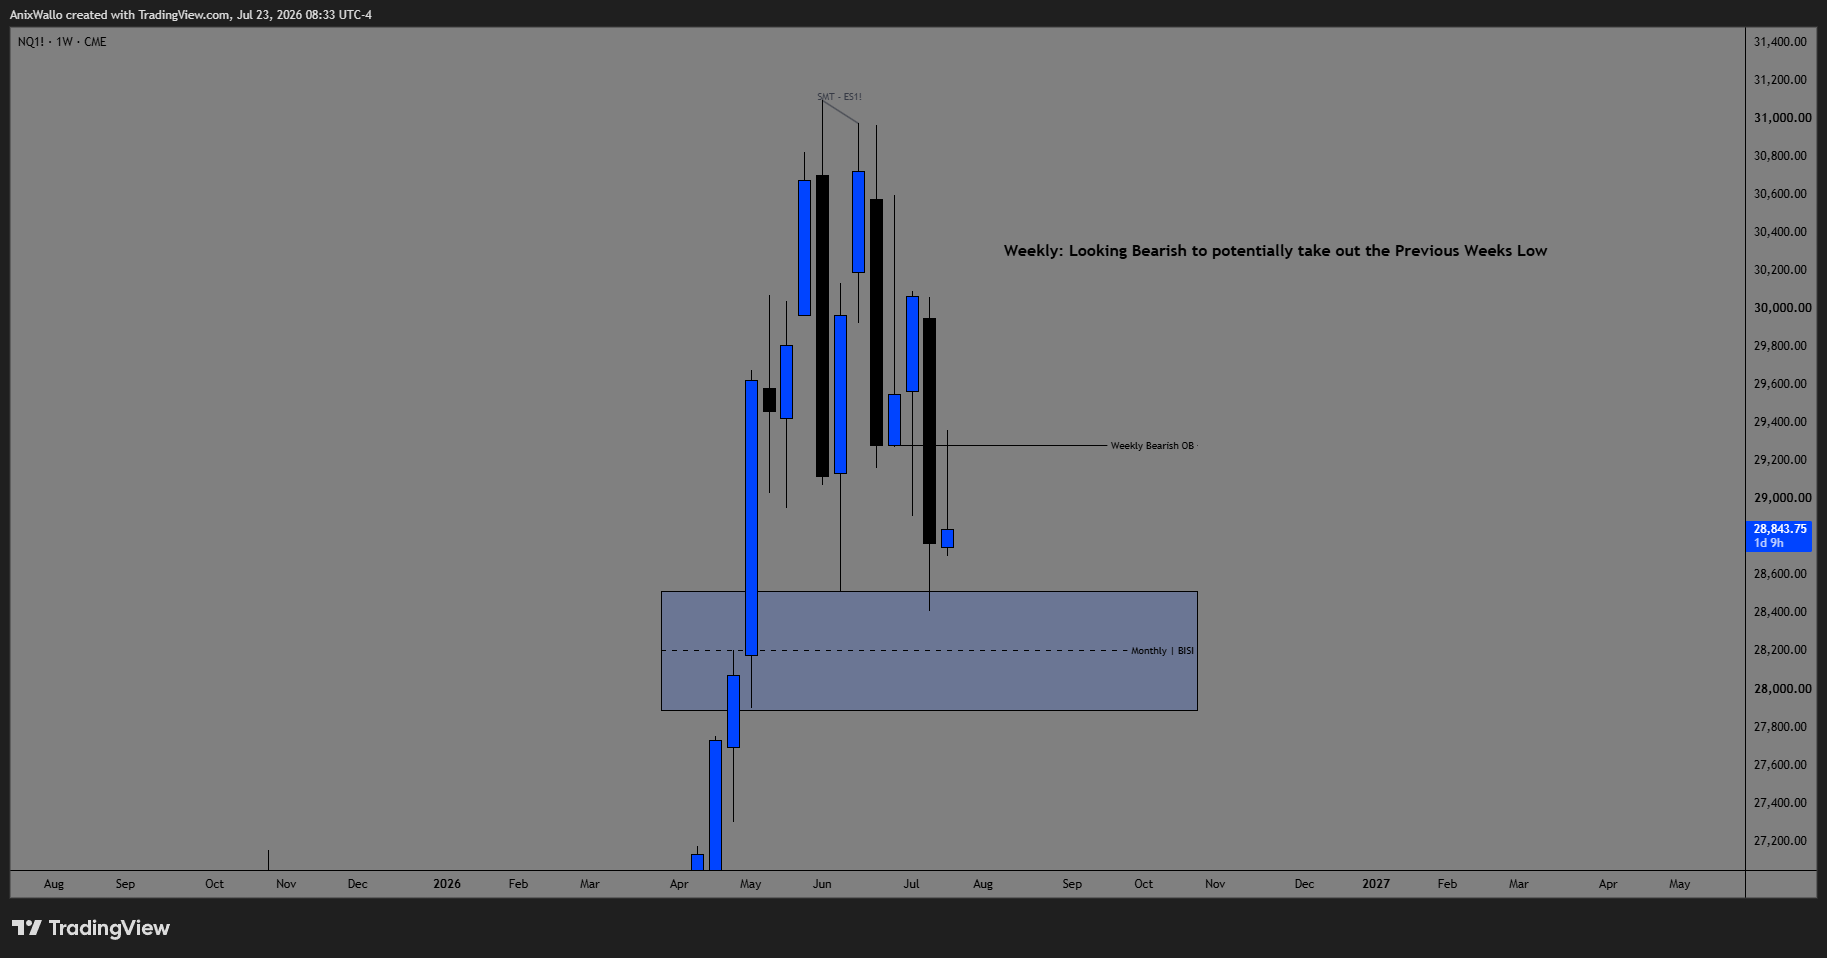
1WWeekly — Bearish, Toward The Previous Week's LowClick chart for full resolution
Start at the top of the stack. The weekly is bearish and looking to take out the previous week's low. There's a Weekly Bearish OB overhead that price is respecting, and the real magnet underneath is the Monthly BISI (~28,000–28,450). SMT vs ES printed at the highs on the way down. When the highest timeframe is pointing at a draw below, everything on the daily should be read through that lens: rallies are for selling, not for chasing.
1DDaily — The Draw Sits Below, PDH/PDL Frame The DayClick chart for full resolution
Same story one timeframe down. The Draw on Liquidity is the Monthly BISI below, ~28,450 — that's what the daily is being delivered toward. PDH and PDL frame today's range with a Daily SIBI overhead as the premium array to sell from. Two SMT-vs-ES prints already mark the failed pushes higher. No A+ setup pre-market, so this is a watch-and-react day — but the lean is lower, into that draw.
Watch this play out live
We hunt liquidity live on Discord every trading day — and the recap gets posted win, lose, or no-trade.