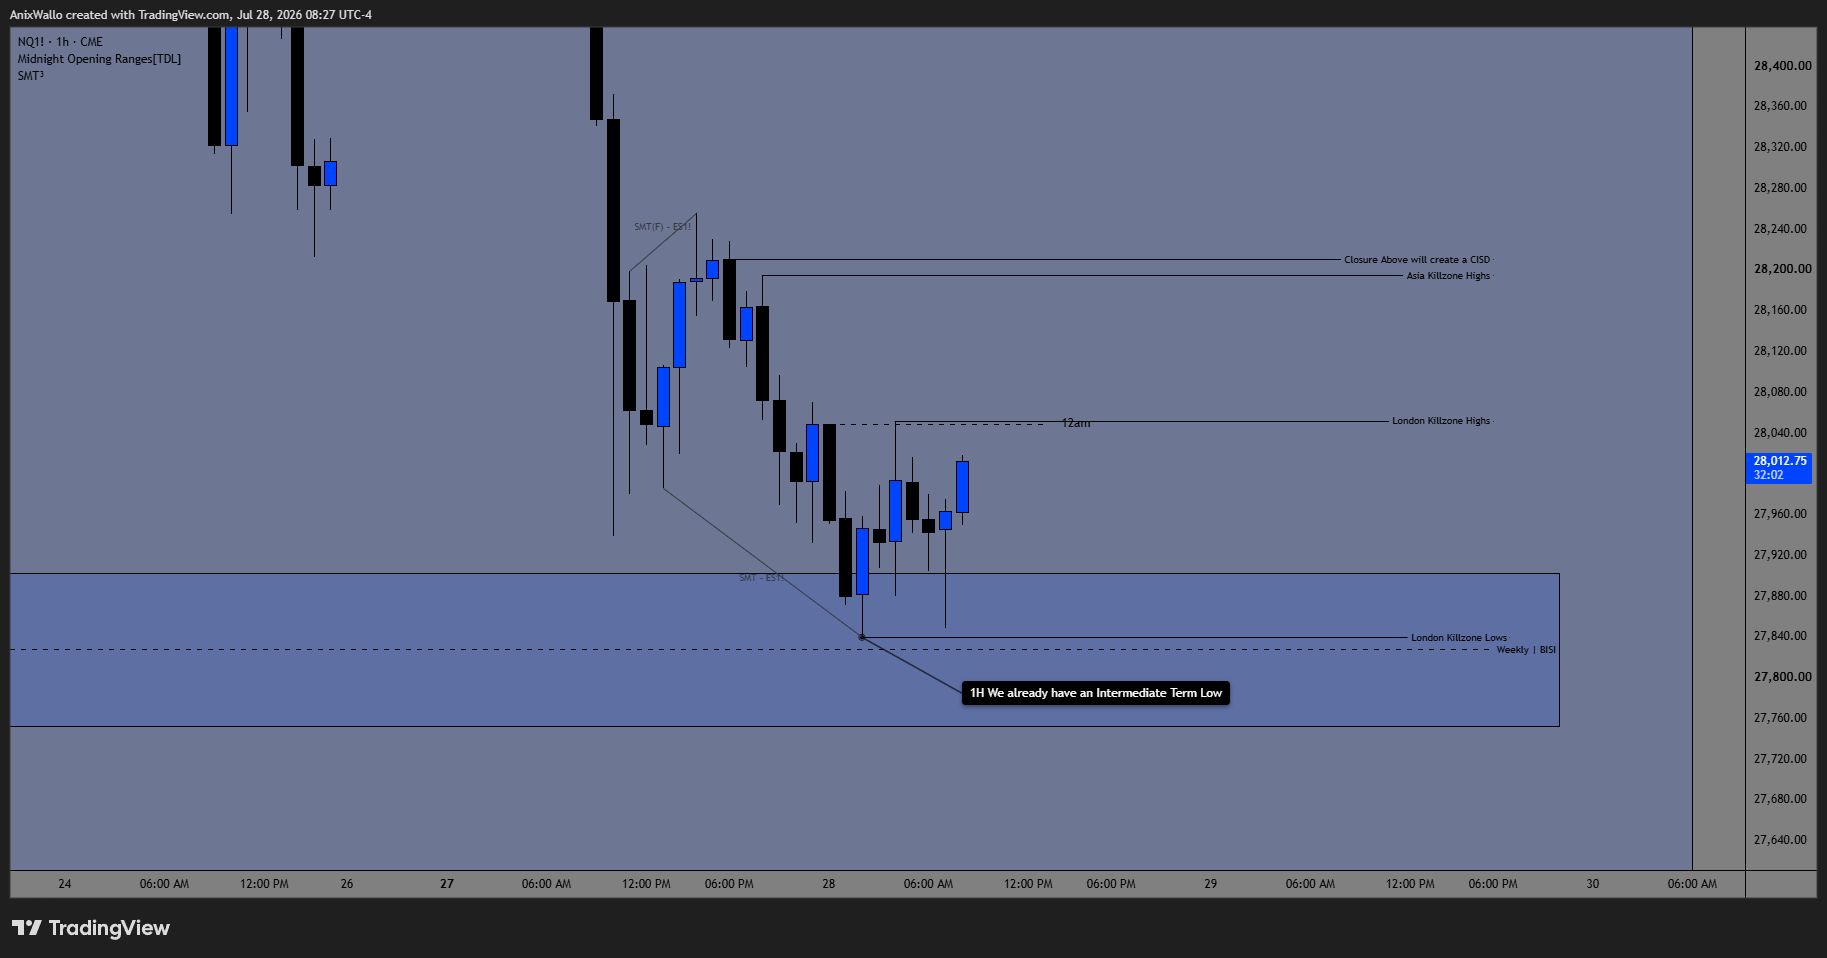
Price is sitting inside stacked HTF bullish FVGs — Monthly and Weekly at the same time.That's a no-short area for me, and enough confluence to look for longs right here. I want the Long Term Low to complete, then price to take the Lot of Liquidity above and create a CISD — and from there I'm expecting the reach toward the ATHs. If it just grinds lower instead, I'm out. Posted before the open, judged after.
Bullish — no shorts. Stacked in Monthly + Weekly bullish FVGs
The entry
Willing to long here — the HTF confluence is already there
The trigger
Take the Lot of Liquidity, then a CISD above it
The ultimate draw
ATHs — the Lot of Liquidity is the checkpoint on the way
The PathLong Term Low → Lot Of Liquidity → CISD → ATHs
STEP 1
Long Term Low
Completes down in the Weekly BISI area
STEP 2
Take Liquidity
Runs the Lot of Liquidity resting above
STEP 3
CISD
Closure above it flips delivery bullish
STEP 4
ATHs
The reach higher — the real draw
InvalidationIf price just grinds lower through the Weekly BISI instead of holding — the bullish FVG support has failed and I'm not interested. No trade.
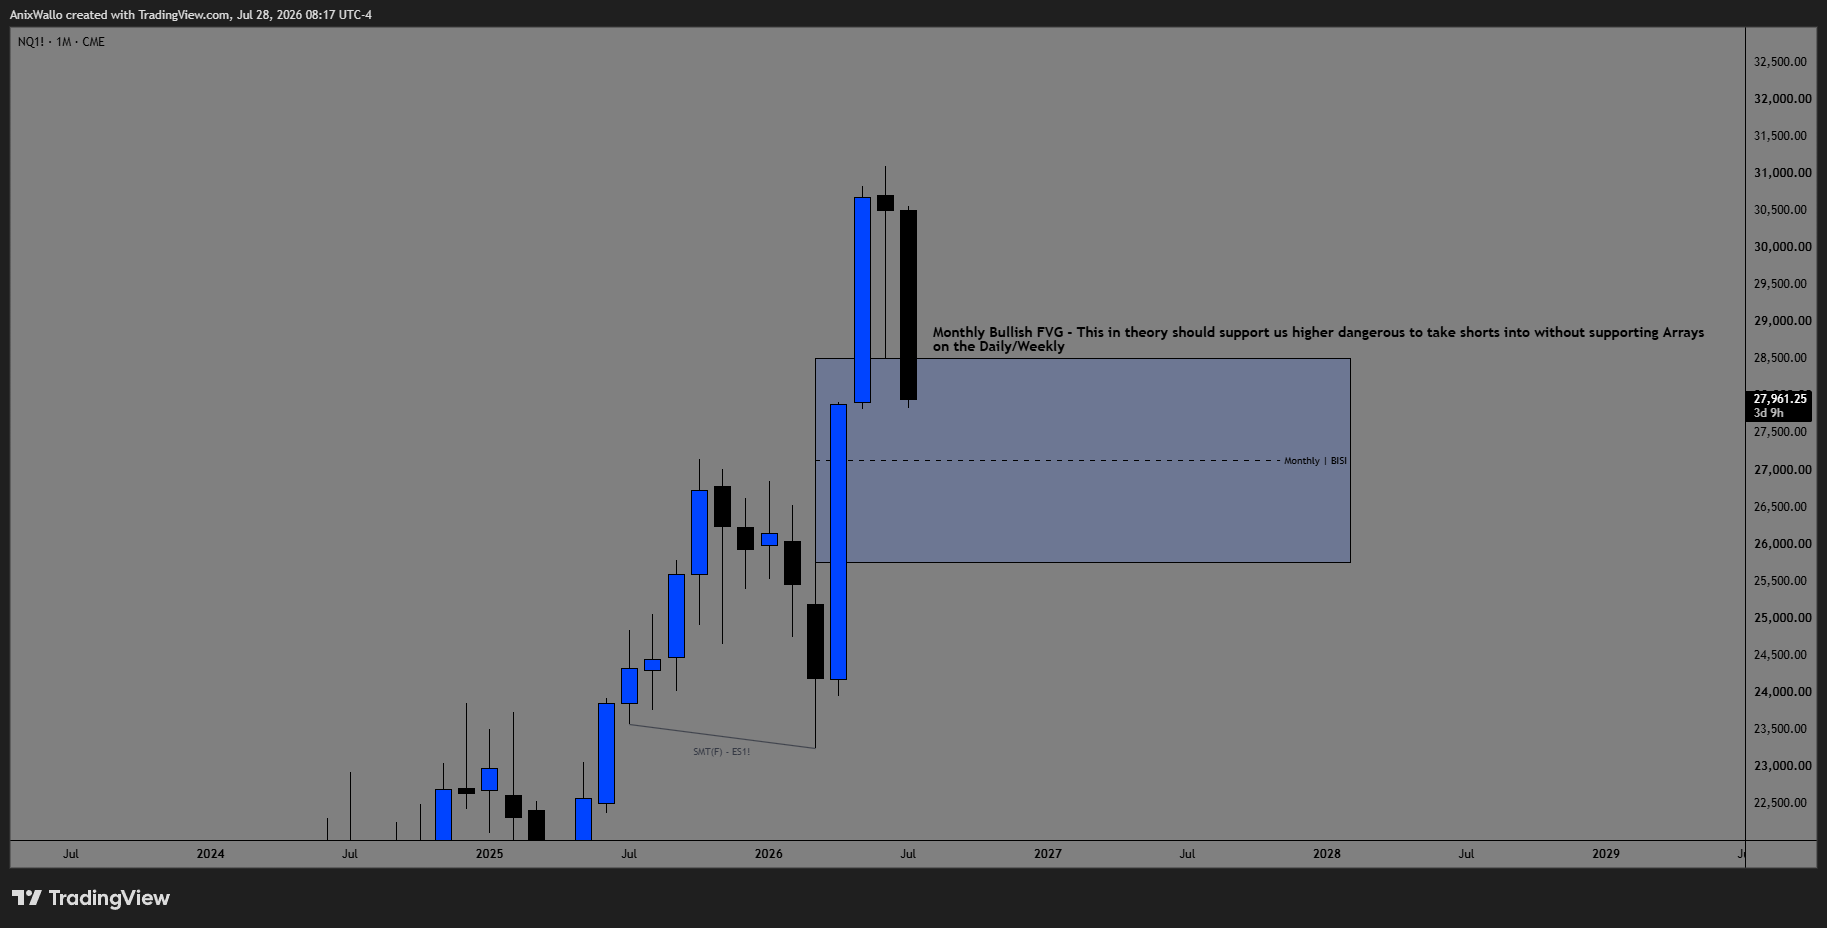
1MMonthly — Tapped The Monthly Bullish FVGClick chart for full resolution
Start at the very top. Price has tapped into a Monthly Bullish FVG — in theory that should support us higher. This is the first reason I'm not interested in shorts: it's dangerous to short into a monthly bullish array without supporting arrays on the Daily/Weekly, and right now those line up bullish too.
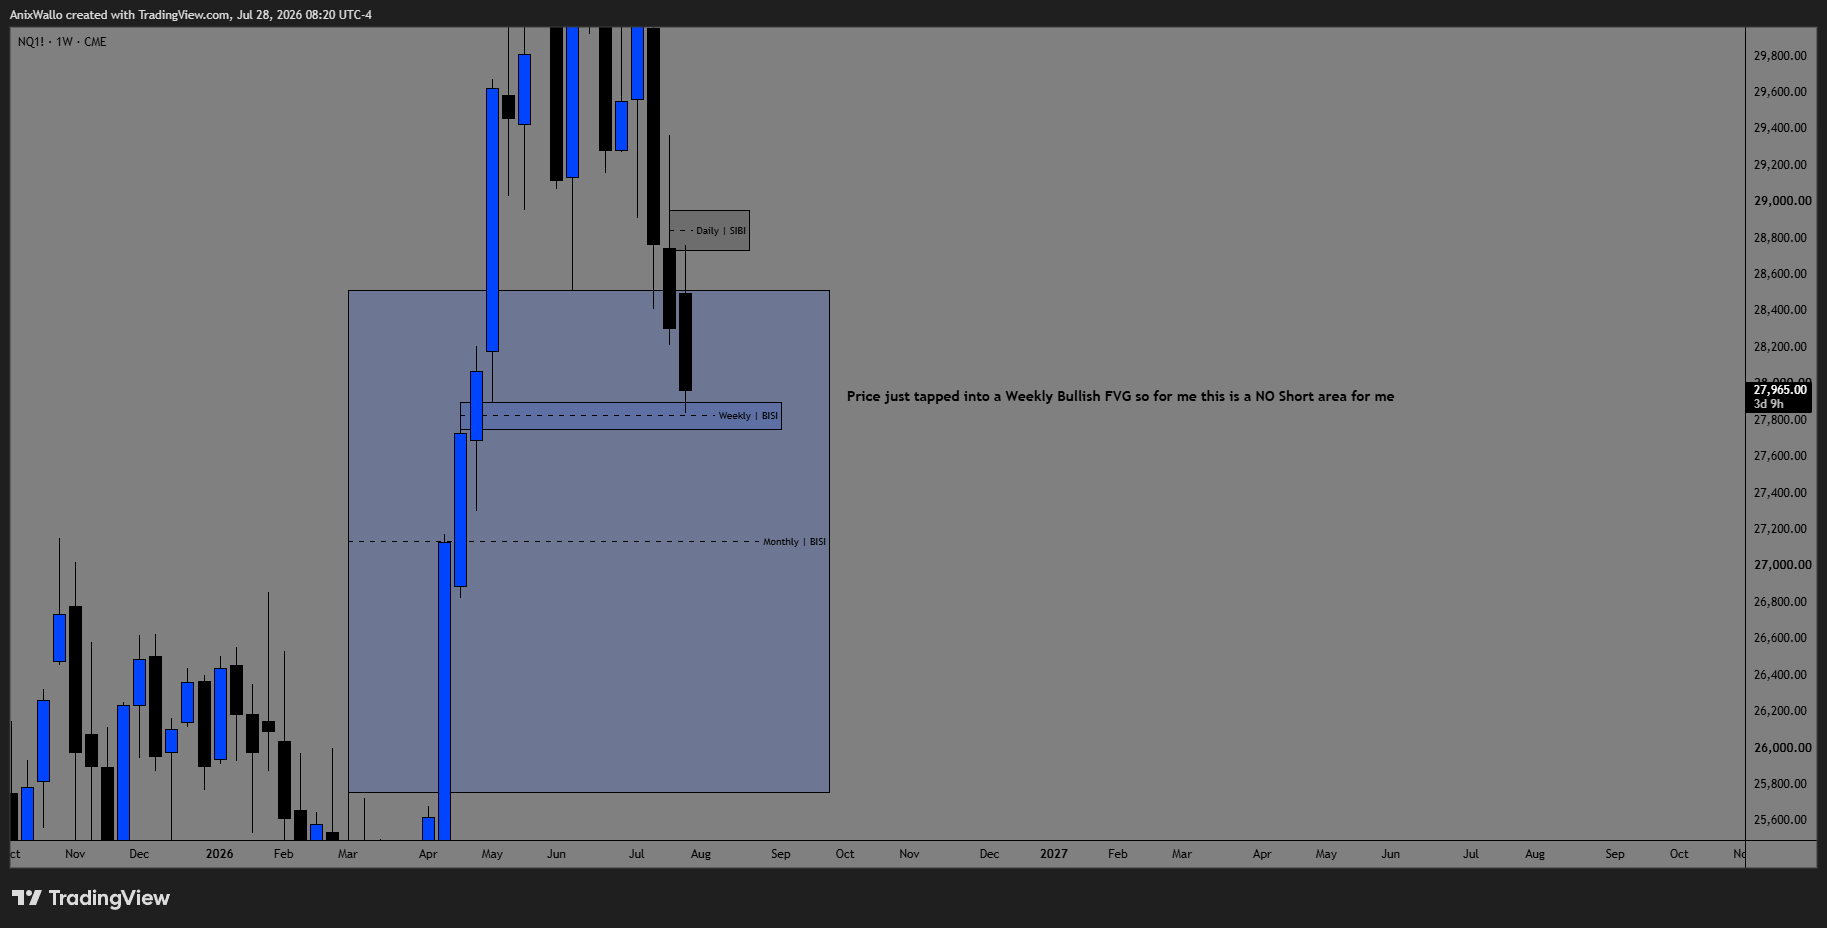
1WWeekly — Also Inside A Weekly Bullish FVGClick chart for full resolution
One timeframe down, same story. Price just tapped into a Weekly Bullish FVG. For me that makes this a NO SHORT area — I'm now stacked inside two HTF bullish gaps at once. That's the confluence that lets me look for longs here instead of waiting.
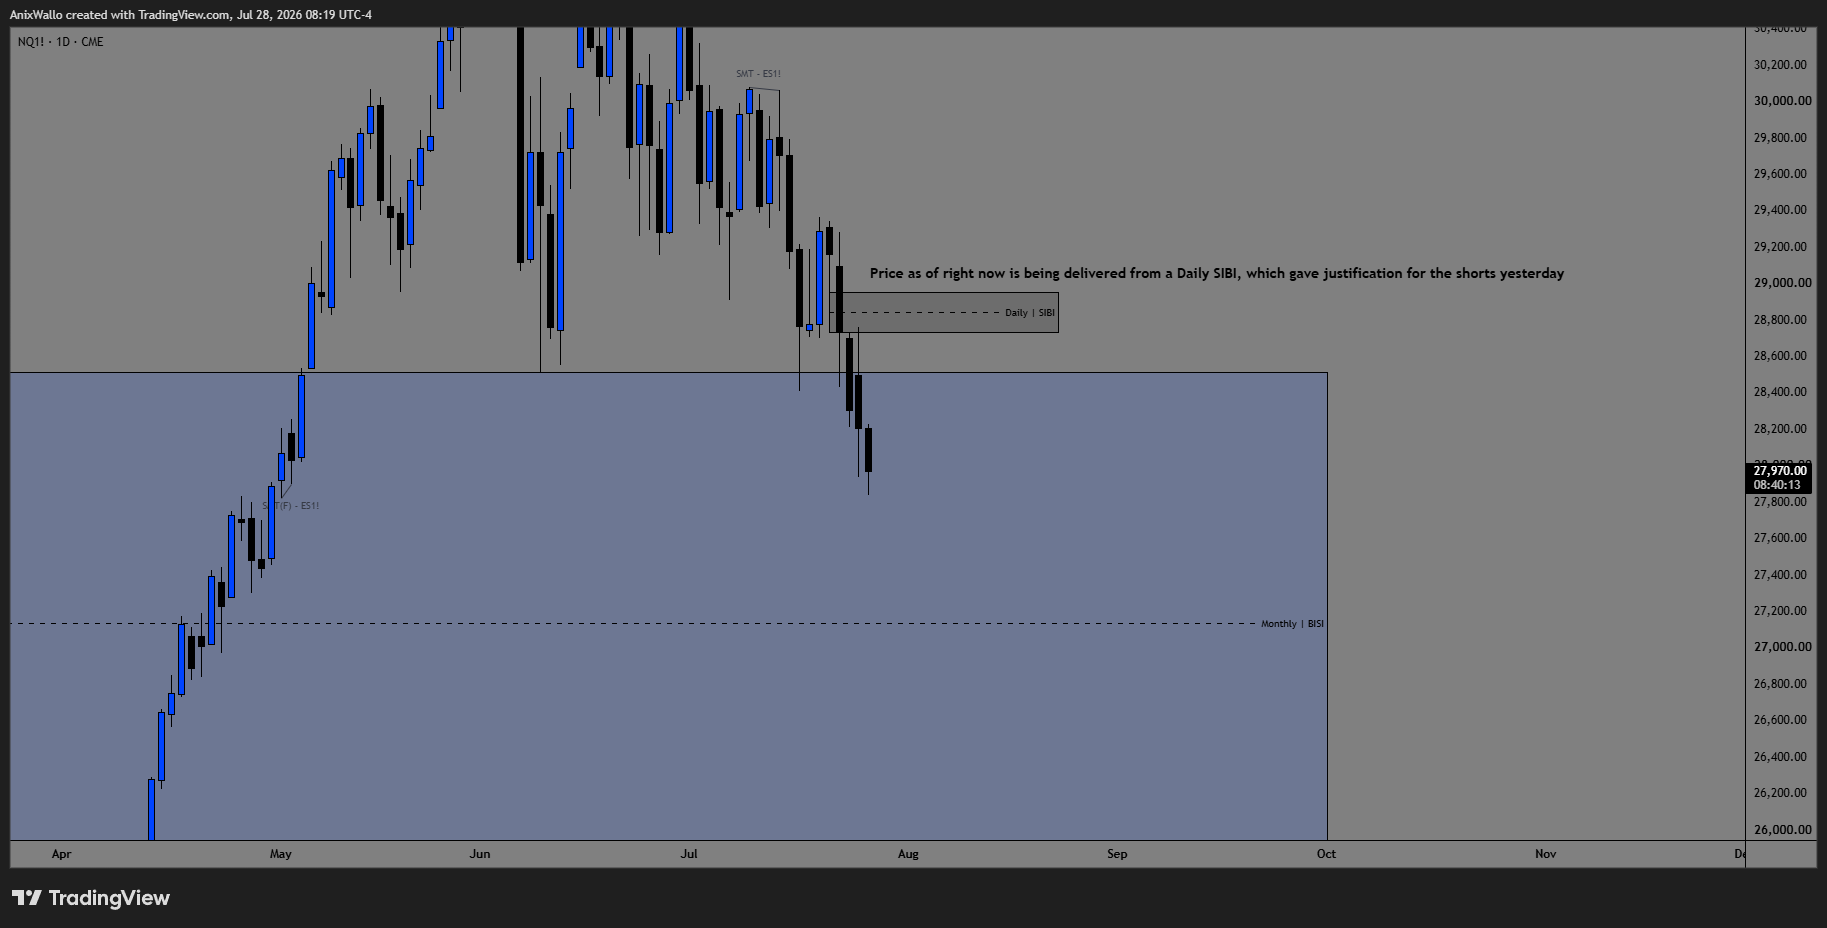
1DDaily — Delivered From The Daily SIBIClick chart for full resolution
Price was being delivered from a Daily SIBI, which is what justified the shorts on Monday. But that delivery has now dropped price straight into the HTF bullish FVGs above. The short did its job; now we're at the level where the other side sets up.
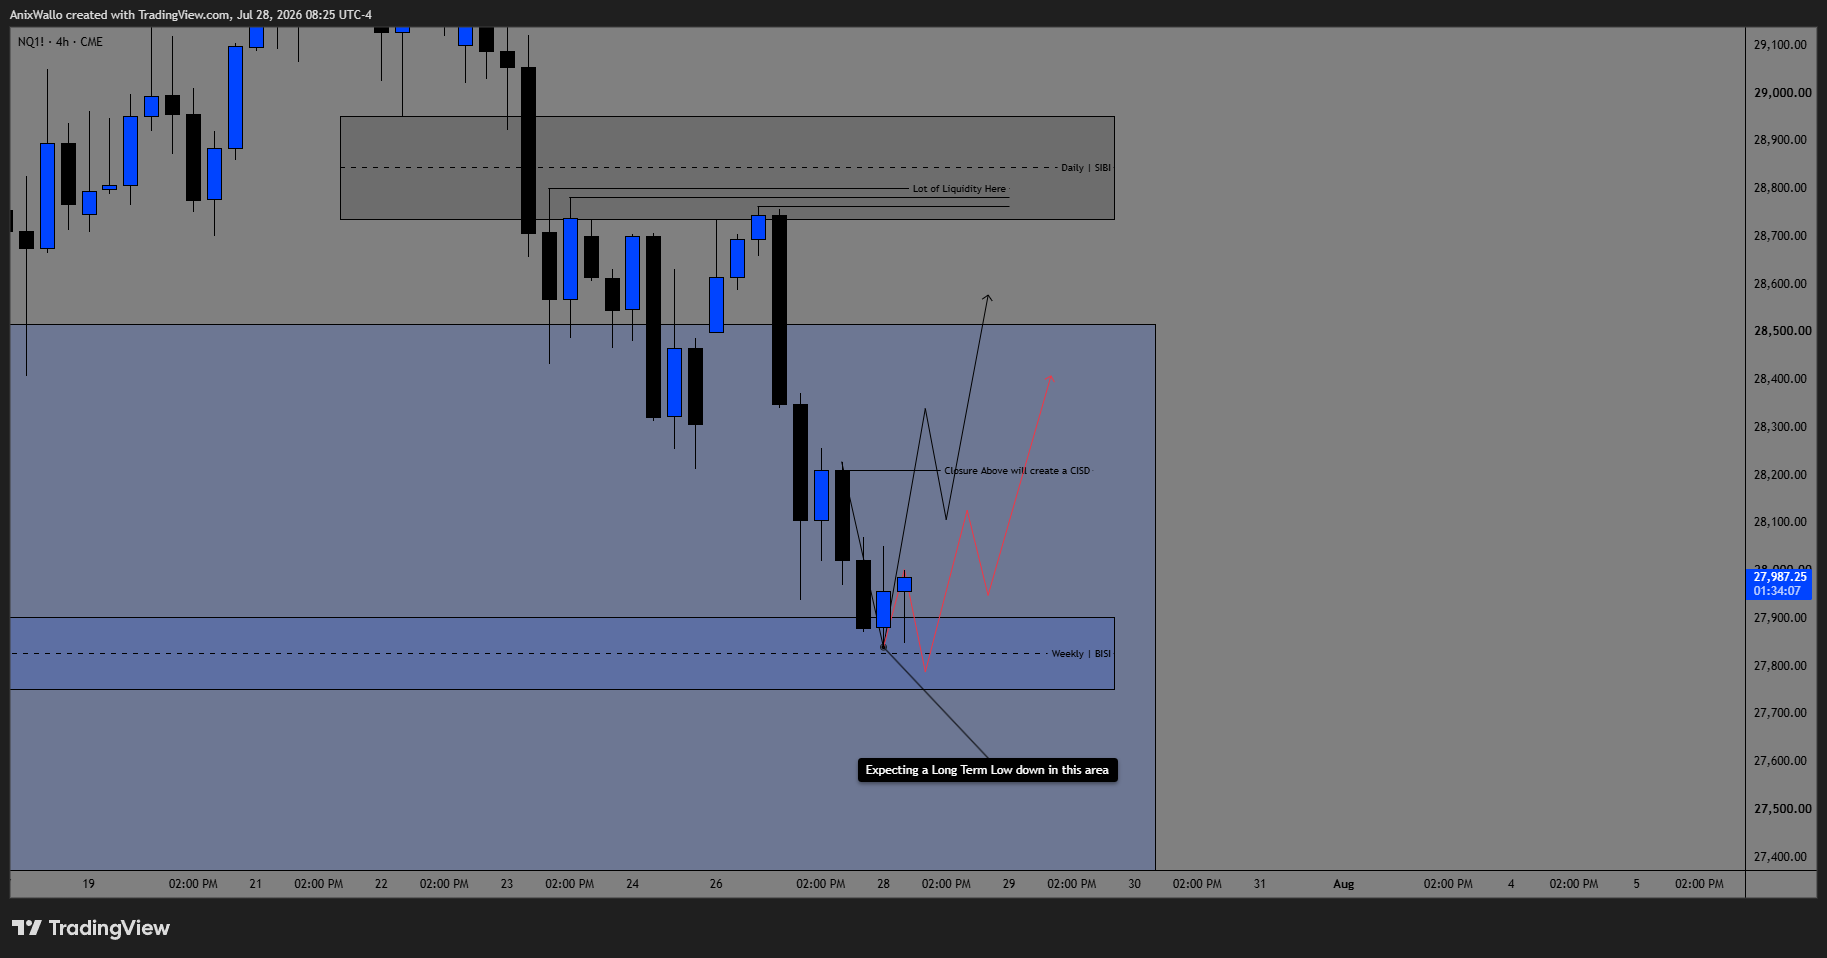
4H4H — Expecting The Long Term LowClick chart for full resolution
This is where the plan forms. I'm expecting a Long Term Low to print down in the Weekly BISI area. Above sits the Daily SIBI and a lot of resting liquidity. The path: form the low, take the Lot of Liquidity, then a closure that creates the CISD — and from there I'm looking for the reach higher.
1H1H — Intermediate Term Low Already InClick chart for full resolution
On the 1H we already have an Intermediate Term Low. The draws above are the Asia and London Killzone Highs; below sits the London Killzone Lows and the Weekly BISI. I want price to hold this structure, take the liquidity above, and confirm the shift up.
Watch this play out live
We hunt liquidity live on Discord every trading day — and the recap gets posted win, lose, or no-trade.